
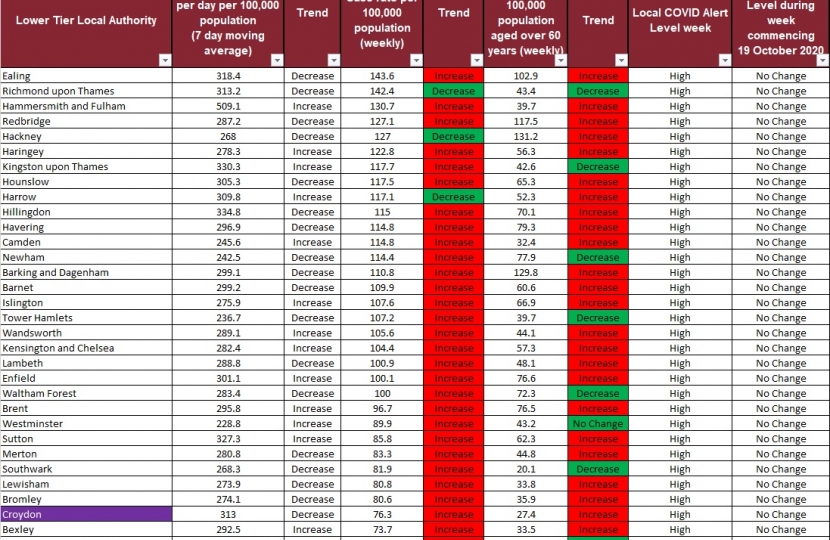
The government has started publishing a weekly report giving epidemiological coronavirus data for each local authority in England. The latest figures are for the week up until October 14th. Like the rest of London we are in the High alert category, but the pattern across the capital is not uniform. For the moment at least, relative to other London Boroughs, Croydon is doing well.
Given that London Boroughs vary widely in population size, Croydon being one of the biggest, the best comparison is to look at the rate per 100,000 of population. Despite complaints that up till recently we did not have a permanent testing facility, our rate of testing at a 7-day moving average of 313 per day is the seventh highest of the thirty-three London local authorities (thirty two boroughs and the City of London).
Yet although we are testing a lot of people, our case rate per 100,000 of population of 76.3 cases per week is the fourth lowest. We also have the fourth lowest rate in cases amongst the most vulnerable age group, the over 60s. As with all statistics, we need to dig below the surface, and Croydon’s demographic influences the picture here. We have a relatively young population so for the older age group a rate per 100,000 of population will look artificially low because we have a relatively low proportion of over 60s in the population. No room for complacency.
The picture, though, is far from rosy. The bad news is that the rate of positive cases, both generally and in the over 60s is increasing across the capital. Looking at the spreadsheet above we can see that the rate in the general population is increasing in twenty-nine of the thirty-three local authorities, including Croydon. The virus continues to spread.
The bottom line is, continue to follow Hands-Face-Space and the rules for a High Alert area shown in the poster attached.